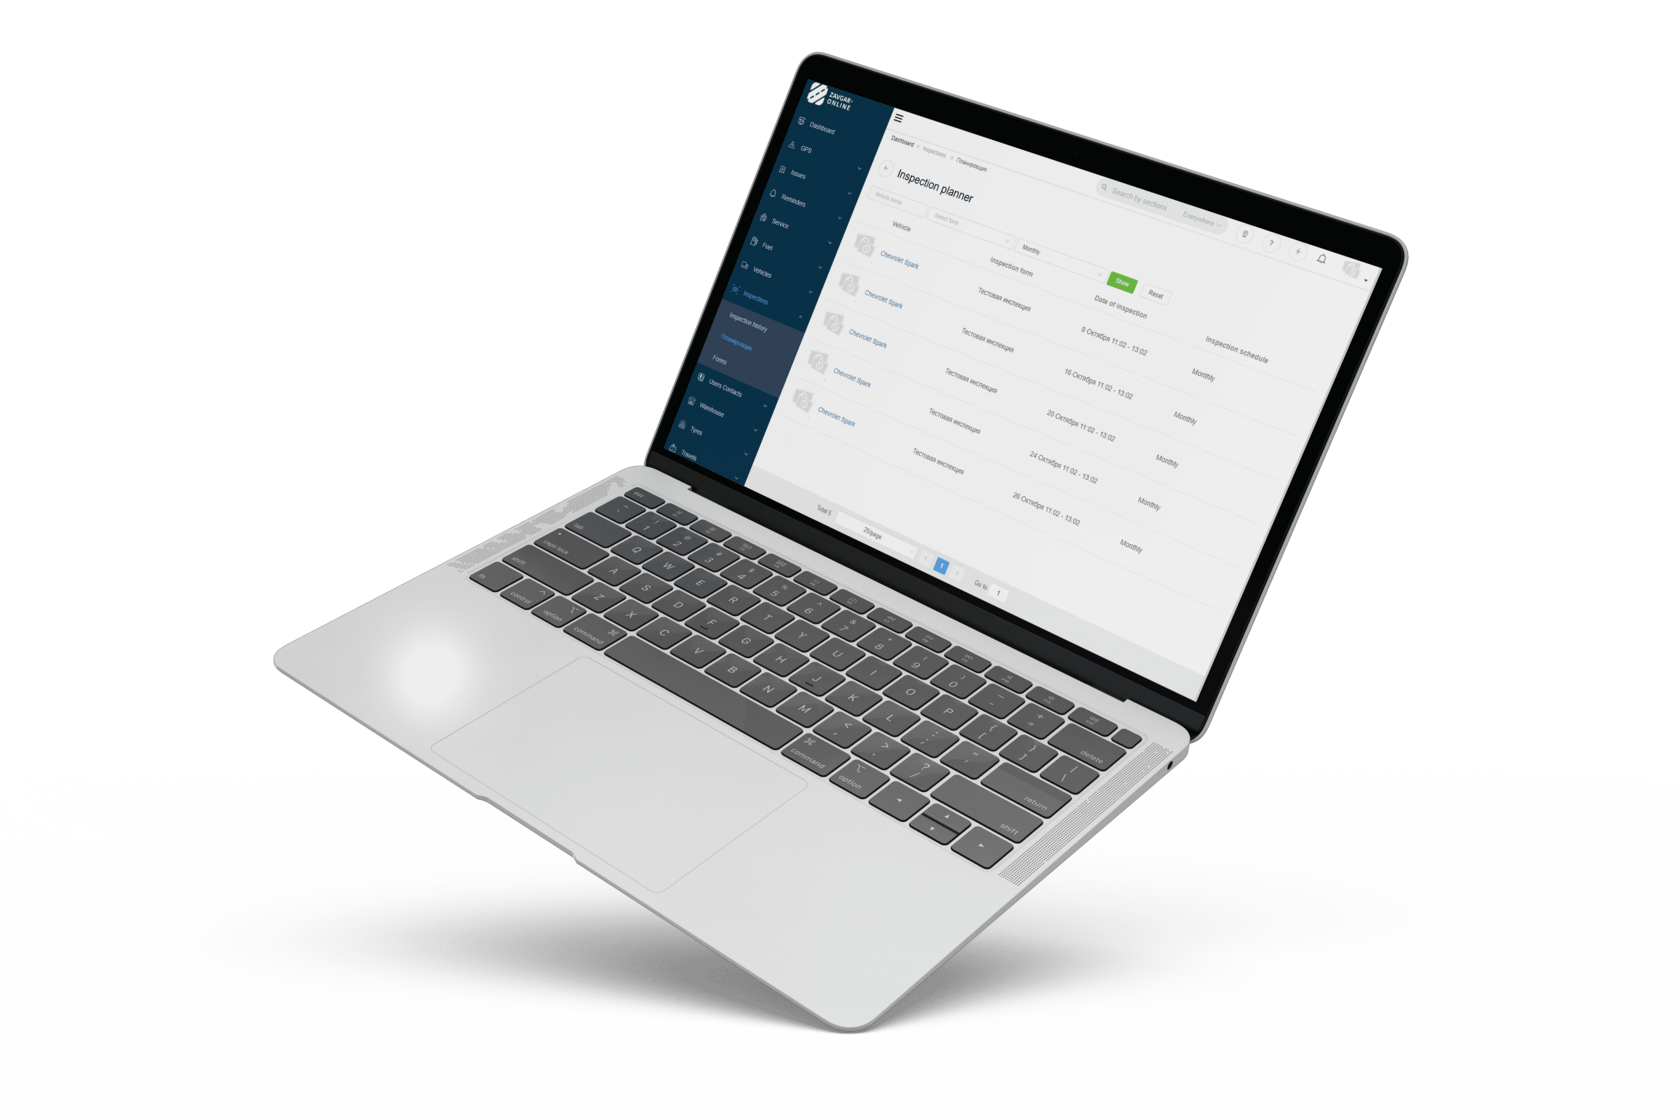
Fleet Maintenance Management System
Defect detection through regular inspections

Maintenance and repair planning

Reducing the risk of accidents, breakdowns and downtime

Zero implementation cost
Does not require installation of additional equipment
Access to the system from any device (smartphone, tablet, laptop, etc.)
Understand how 98% of all companies manage their fleet?
Notebook

Excel

What are the main problems with these methods?
Vehicle downtime

1
Maintenance and repairs in violation of the terms

3
Long hours of searching for typical spare parts

2
Theft of materials and spare parts

4
The manager has a constant feeling of being deceived

5
The cost of operation is higher than the benefits received

6

What is the most advanced maintenance and repair management tool and why do implementing companies benefit from up to 50% economic benefits?
Zavgar online is a cloud-based service for managing maintenance and repairs. There are many good old tools out there for maintenance and repair. They were certainly effective to one degree or another. Management of any processes in the company can be carried out using software solutions that minimize the human factor, reduce labor and increase the characteristics of each employee at times.
The Zavgar Online system is one of those. It only allows the most important of a large number of numbers and text. For a transport section, this is the operating cost. Reducing it is the key task of every employee.
Zavgar Online reduces total cost of operation by 10-40%!
How does the Zavgar Online system reduce the cost of operation?
Service planning

Zavgar Online allows you to schedule scheduled maintenance and the same scheduled repairs. Enter service reminders and the system will warn you in advance about the need for a service, and after completion, it itself prolongs the deadline for the next, depending on the conditions you approved (mileage, engine hours, time).
Automate the process of receiving requests for unscheduled repairs or services from people on the ground

The Problems module will allow you to track the entire chain, from the occurrence of an emergency situation to the work already completed. Data transfer is carried out through a mobile app, with the ability to upload photos.
Warehouse accounting of spare parts and materials for maintenance and repair

The Warehouse module is suitable for both large companies with a complex warehouse infrastructure and small companies that purchase spare parts for specific repairs. The whole process, from the moment of ordering to the actual installation, is completely transparent for all participants. Who bought it from, what article, at what price, etc. Important information is available in a few clicks.
Accounting and analysis of all expenses

Purchase of spare parts, repair and maintenance costs, fuel and lubricants, etc. costs. All this will be under detailed control. It has long been proven that as soon as the company implements accounting in any of the departments, costs are automatically reduced.
Inspection

Periodic inspections of machinery and equipment are not only important from the point of view of compliance with the law and manufacturer's requirements, but also are an excellent tool for identifying problems that could lead to serious damage and downtime in the future.
Automation of technical inspections and repairs

Control of deadlines, compliance with standards and costs.
Work with providers

All contacts, transactions, purchase amounts with reference to further use.
Reports and data visualization

Get access to the most important information in two clicks. Visualization will help to compare the received data with past periods, will allow you to see trends and highlight the most important thing from a large flow of information.
Decrease in operating costs from 10 to 40%
Control of operating costs
Prevention of emergencies through timely maintenance
Service book online
What modules does Zavgar Online consist of?
Maintenance automation

Purchasing and Suppliers
Fuel Management
Reminders
Parts&Inventory
Work Orders
Inspection
Issue Management
What does Zavgar.Online system look like?

Start managing your fleet right now
You can try it for free.


